In the article about Logistics Network Modelling, we went through why and how to create a baseline. One of the most important points was to reflect as much as possible the current state of the network in order to improve it.
But first of all, what are you trying to optimize? The goal is usually to reduce the costs and/or improve the service level, but what levers can you activate? Do you want to modify your current footprint? Upgrade your fleet? Evaluate different transport modes? Review your inventory policies? All of the above?
Network optimization can happen at various levels. The Supply Chain Guru software (presented in the previous article on network modelling) is a powerful tool to do so. It allows the user to work on 3 topics, simultaneously or separately: Network, Production, and Inventory.
Network Optimization
By network optimization, we understand the optimization of nodes and flows. This means we will be able to modify:
- The size and location of warehouses or production facilities
- Fleet capacity, transport modes and flow consolidation
At C2.0, optimal location of warehouses is usually the first step for every network optimization project. This step is known as “Greenfield” analysis.
Greenfield Analysis
A Greenfield analysis aims at defining the ideal location for your distribution centres, by identifying the centres of gravity of your network.
We start from scratch, excluding the current nodes. By keeping other parameters such as customer orders and transport modes, Supply Chain Guru computes the ideal location of your warehouses. We can therefore overlay the result of the Greenfield analysis with your current network and validate if the warehouses are located at the same places or not.
In other words, the Greenfield analysis allows us to compare your current network versus an ideal situation. To compute centres of gravity, Supply Chain Guru minimizes the weighted average distance to customers (i.e., minimizes transportation costs).
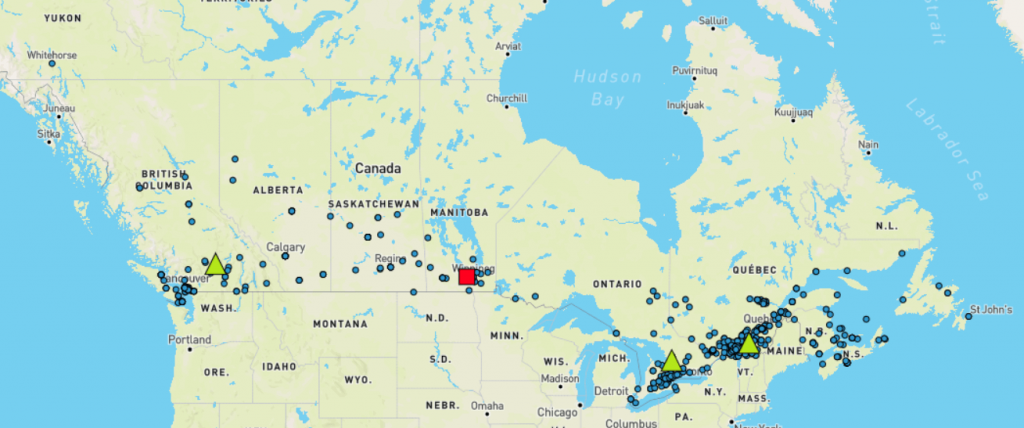
We can take it even further. It is possible to keep the actual number of warehouses and see what the ideal locations would be for new warehouses. Let’s take the following example :
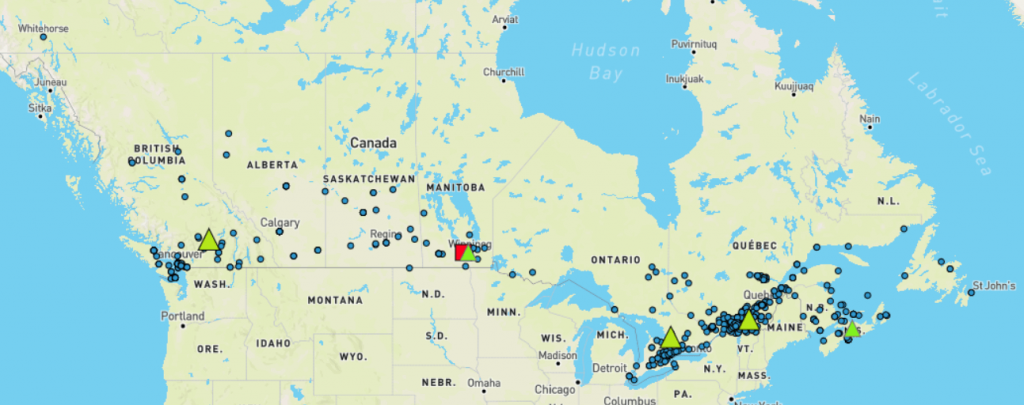
Company XYZ has clients all across Canada (in blue), a manufacturing centre (in red) and three warehouses (in green). The manufacturing centre does not act as a distribution centre in this model.
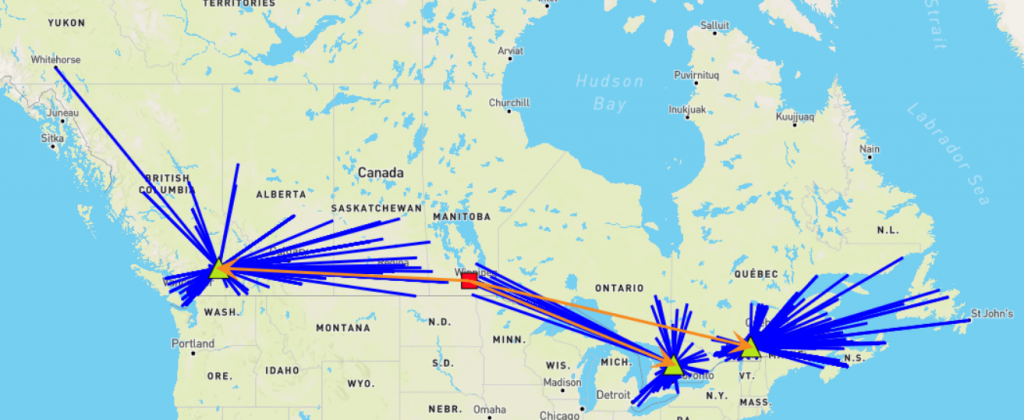
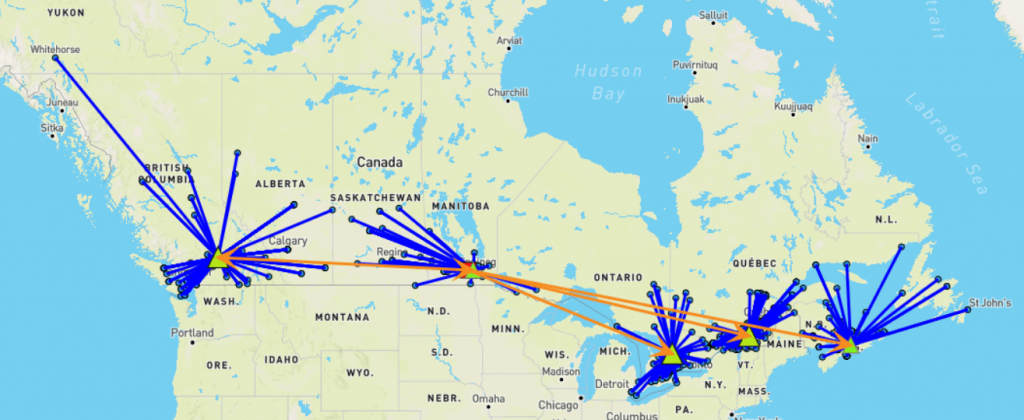
Let’s now assume that you decide to add two new distribution centres… You just need to specify that to Supply Chain Guru and run the Greenfield analysis. Supply Chain Guru will find the two ideal locations for your next warehouses, based on customer orders and existing locations (distances are calculated using the longitude and latitude).
Now that we have two new locations, what do we do with this information?
First of all, check that these two new locations make sense. Are the warehouses in an accessible area? Will there be enough qualified labour in the vicinity?
Once validated, you can add these two warehouses to your network, give them an inventory policy, maximum capacity, fixed and variable costs, etc. and run a new scenario to understand the full picture of your new network.
Warehouse location based on service level
We saw that with the Greenfield analysis we can minimize the weighted average distance between warehouses and customers.
Another approach would be to minimize the locations that would ensure a maximum service level within a certain range.
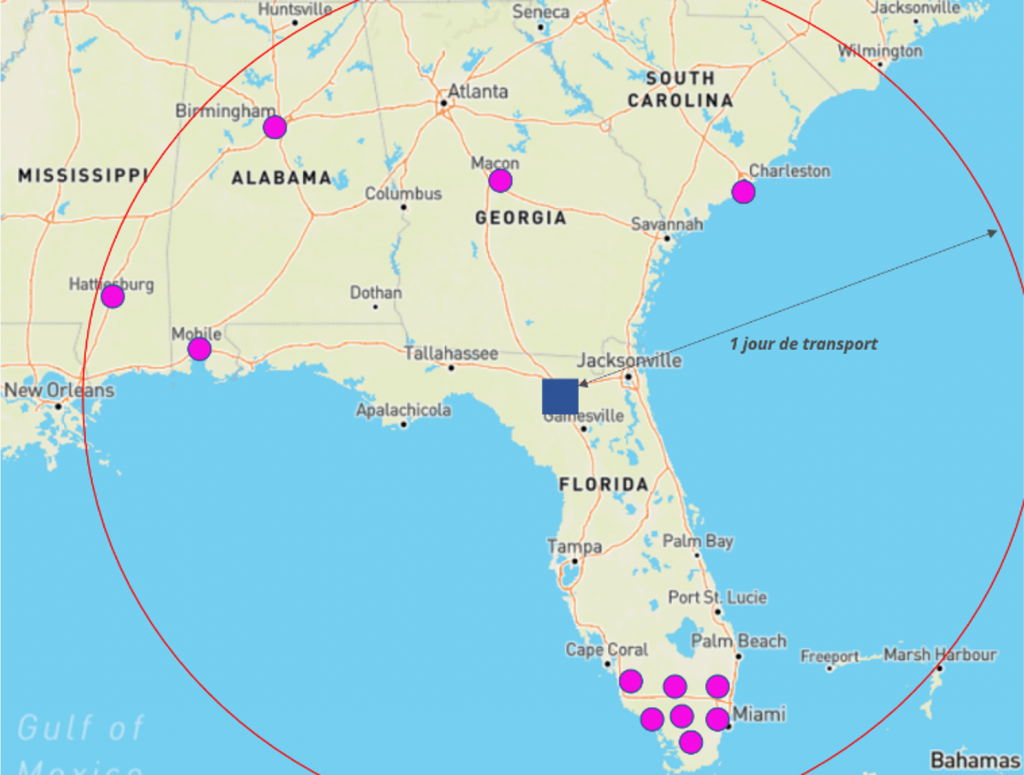
Let’s assume that a truck can go for 700 km in a day. You wish to find the ideal locations for your warehouse that maximizes the number of clients in a day.
This constraint can be modelled in Supply Chain Guru.
In this case, the weighted average distance is not optimized and will be higher than compared to a Greenfield analysis. However, you will ensure that your clients will benefit from a service level in accordance with your company standards.

In the end, it is all about defining your key success factors to come to decide on the best solution. C2.0 is by your side during this step, as we understand it is as important as the modelling stage.
Flow optimization
Flow optimization is the second step when looking at improving your current network.
Here, we will consider that the nodes are defined in advance and cannot be modified. This is usually the case when one uses ports or airport infrastructure on which we usually have very limited control or simply when you cannot or do not to modify the current locations of your warehouses.
Starting from the baseline, we will consider several improvements to bring to the model. It can be done in various ways, including:
- Deleting historical constraints
- Considering new flows
- Adding new transport modes
Deleting historical constraints
Historical constraints are defined in the baseline (see the article how to model your logistics network) to reflect reality.
A common situation is when you delete historical flows from warehouses to customers, either to let the system decide on the best flows to achieve or because a new warehouse, closer to customers, was recently made available.
For example, a distribution centre in Germany ships electronic devices to malls in Portugal. This company has been working like this for years but recently acquired a new facility in Spain.
With the baseline, the model can only use the flow Germany – Portugal. This flow will have to be deleted as you would like to let the model use the Germany – Spain and Spain – Portuguese corridors (using for instance FTL shipments from Germany to Spain and LTL shipments from Spain to Portugal).
Considering New Flows
In the optimization module, you can indicate that you want to create additional flows (which is also what we should do in the previous example). It is not about forcing the software to use a specific lane, but rather let him decide if it is beneficial to use one that was not available before.
If the lanes bring savings and meet the target, then they will be used. If not, then we will see quickly in the outputs that no volume goes through them.
New Flows Example
Let’s take the example of two subsidiaries of a company, one based in England and the other one in France. The two companies export goods to the American market, respectively from the ports of Southampton and Le Havre. We could look at the possibility of consolidating these two flows between the two ports. Are the rates, volumes and destinations different? Based on these elements, the software will propose its optimal solution. It is then up to us to validate if it is worth implementing it or not.
Production Optimization
Although Supply Chian Guru is not software dedicated to production, it can still model some parameters that you would like to consider.
Adding production aspect increases greatly the model complexity. Thus, the first is to determine whether you want to add it to your network model or not.
If your primary objective is the distribution of goods from your warehouses to your clients, then it not necessary to include production.
However, if warehouse selection and outbound flows depend on an optimized production between the different manufacturing centres, then yes, you should consider it.

How to know which manufacturing centre should produce which product based on:
- Fixed and variable costs
- Warehouse storage capacity
- Customer orders
You must gather these data sets to model your production capacities. The level of detail to go into must be defined in advance. C2.0 acts as a partner to support you during this phase. Together, we look at your production and answer various questions such as
- How many products should we consider?
- At which product level, should we stop?
- Which level of the Bill of Material is the correct one to model?
- Should we model production work centres?
- Which costs are fixed or variable?
The optimization will then depend on various factors on which you can influence. For example, increasing the number of shifts within the factory, work centre automation, etc. These factors are taken into account through various scenarios in Supply Chain Guru. The results of the analysis are expressed in terms of fixed and variable costs as well as capacity. It is up to us to compare these different scenarios and select the most profitable one.
Inventory optimization
Logistics network optimization can be achieved by modifying different parameters. A tool such as Supply Chain Guru allows you to act at various levels of granularity, from adding facilities and flows to truck speed, fuel surcharges, taxes or even greenhouse gas emissions.
In any case, each optimization scenario must be analyzed to understand the impacts in terms of costs for your company. Supply Chian Guru allows you to visualize the results at various levels in accordance with what has been modelled.
- Total costs
- Expected benefits
- Transport, production, and inventory costs
But it is up to us, supply chain professionals, to analyze the results and pick the best scenario for our company.
To accomplish this, C2.0 acts as your partner and together we build the key success factors to define your future network. Discussions between all the stakeholders of the network are paramount for optimization projects, and it is through an efficient teamwork that we will meet your targets.
Conclusion
Logistics network optimization can be achieved by modifying different parameters. A tool such as Supply Chain Guru allows you to act at various levels of granularity, from adding facilities and flows to truck speed, fuel surcharges, taxes or even greenhouse gas emissions.
In any case, each optimization scenario must be analyzed to understand the impacts in terms of costs for your company. Supply Chian Guru allows you to visualize the results at various levels in accordance with what has been modelled.
- Total costs
- Expected benefits
- Transport, production, and inventory costs
But it is up to us, supply chain professionals, to analyze the results and pick the best scenario for our company.
To accomplish this, C2.0 acts as your partner and together we build the key success factors to define your future network. Discussions between all the stakeholders of the network are paramount for optimization projects, and it is through an efficient teamwork that we will meet your targets.
C2.0 is an official partner of Coupa. Do not hesitate to reach out to us if you wish to learn more about Supply Chain Guru or for any project about network optimization, we will gladly accompany you in your upcoming challenges.
